
Monitor Tealium API Calls in Real Time
Overview
The Tealium Network Monitor is a specialized desktop application designed to track and analyze network requests directed to Tealium Collect Pixels and other Tealium API endpoints. Its primary function is to intercept and display data from both GET and POST requests, including querystring parameters and request body content, providing developers with immediate visibility into data transmission patterns. This tool is particularly useful for debugging, verifying data collection accuracy, and ensuring proper implementation of Tealium’s customer data hub (CDH) integration within web applications.
Targeted at web developers, QA engineers, and digital analytics professionals, the software supports real-world workflows where accurate tracking of tag-level data is essential. It enables users to validate that the correct data is being sent to Tealium during user interactions, such as form submissions or page views. By offering a clear console-based output of raw request data, the tool streamlines troubleshooting and enhances transparency in data collection processes.
Developed by Tealium, a recognized name in customer data platforms, the application reflects the company’s commitment to developer-centric tools. The tool operates as a lightweight desktop utility, designed for integration into development and testing environments. It does not modify or interfere with network traffic—its role is purely observational and informational.
Key Features & Capabilities
- Real-time Request Monitoring – Detects and logs all network calls made to Tealium Collect Pixels and related API endpoints as they occur.
- GET Request Analysis – Captures and displays querystring parameters from HTTP GET requests, allowing developers to verify the data being passed in URLs.
- POST Request Inspection – Extracts and outputs the full request body from POST calls, providing visibility into structured payloads sent to Tealium.
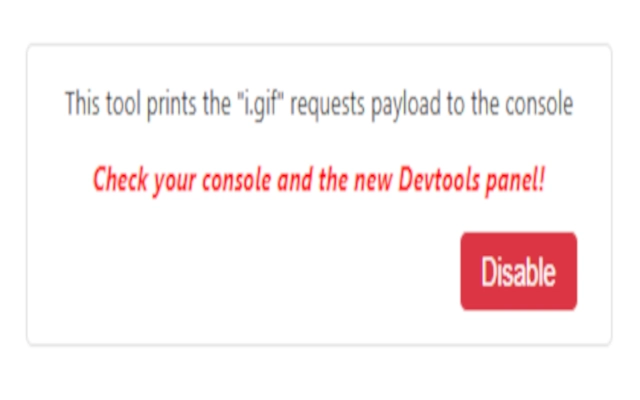
- Console Output Display – Presents all intercepted data in a clean, readable console format for immediate review and analysis.
- Developer-Focused Design – Built for technical users who need precise, low-level insights into Tealium data transmission without external dependencies.
Use cases include validating tag implementation during development, diagnosing data discrepancies in analytics pipelines, and confirming that sensitive information is not being transmitted unintentionally. The tool supports iterative testing by allowing developers to trigger actions on a website and immediately see the resulting network activity, enabling rapid feedback loops in the development cycle.
User Interface, Workflow & Performance
The application features a minimal, console-based interface focused on functionality rather than visual polish. Navigation is straightforward, with no complex menus or settings. Users launch the tool, initiate a web session, and begin observing network calls in real time. The workflow is designed to be lightweight and efficient, minimizing setup time and user overhead.
Interaction is event-driven: once active, the software listens for outgoing requests matching Tealium’s known endpoints and logs them automatically. There is no need to configure filters or specify URLs—detection is based on known patterns in the request path. The console updates dynamically as new calls are detected, providing immediate feedback.
Performance behavior is not detailed in the provided information. The developer did not specify resource usage details, including CPU or RAM consumption. However, given the tool’s purpose and file size of 2.1 MB, it is expected to operate with minimal system impact. Stability is assumed to be consistent with standard desktop applications, though no formal reliability metrics were provided.
Compatibility & System Requirements
The Tealium Network Monitor is compatible with both Windows and Mac operating systems, supporting a broad range of desktop environments used by developers. The software version is 1.0.0, with a file size of 2.1 MB, indicating a lightweight deployment.
Exact system requirements were not listed. The developer did not provide additional system requirements beyond the supported platforms. This suggests the tool is designed to run on standard development machines without demanding hardware configurations. Installation is likely straightforward, with no complex dependencies or prerequisites.
Pros and Cons
Pros
- Specifically tailored for Tealium CDH debugging and monitoring
- Provides real-time visibility into both GET and POST request data
- Lightweight at just 2.1 MB, with minimal system footprint
- Free to use, with no licensing barriers for developers
- Console-based output ensures raw data integrity and clarity
Cons
- Interface is minimal and may lack advanced filtering or export options
- No visible support for request filtering or search functionality
- Limited to Tealium endpoints—no broader network monitoring capabilities
- No documented update mechanism or version history beyond 1.0.0
- Exact performance impact on system resources was not specified
FAQ Section
Is the Tealium Network Monitor compatible with Windows and Mac?
Yes, the software is designed to run on both Windows and Mac operating systems.
Is the tool safe to use? Does it modify network traffic?
Yes, the tool is safe to use. It only observes and logs network requests without altering, blocking, or modifying any data sent to Tealium endpoints.
Can I use this tool offline?
Yes, the application operates independently of an internet connection after installation. It monitors local network activity during active sessions.
Is there a license fee for using this software?
No, the tool is available at no cost. It is free to download and use for development and testing purposes.
How often are updates released?
The current version is 1.0.0. No information was provided about update frequency or release schedule beyond the initial release date of May 20, 2024.
Final Thoughts + CTA
The Tealium Network Monitor delivers a focused, efficient solution for developers working with Tealium’s data collection infrastructure. Its ability to capture and display raw request data from both GET and POST calls makes it an essential companion for validating tag implementation and ensuring data accuracy. While the interface is simple and lacks advanced features, its precision and ease of use make it ideal for technical users who need immediate insights.
Given its free availability, lightweight design, and direct alignment with Tealium’s ecosystem, this tool is a valuable addition to any developer’s workflow. It supports seamless debugging and enhances transparency in data transmission processes.
Download Tealium Network Monitor now